
Read the Financials overview
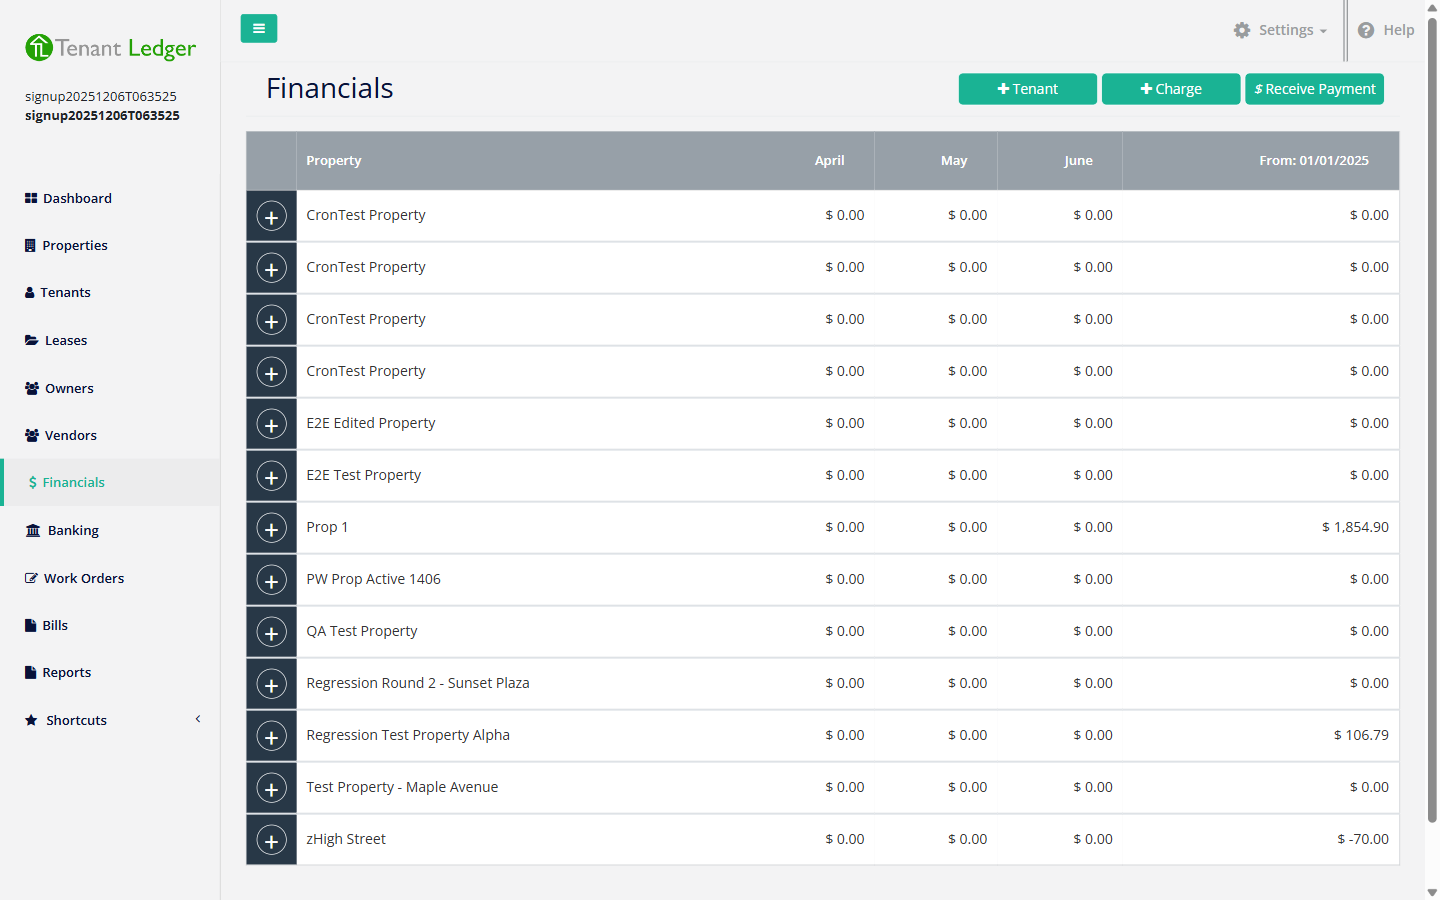
The Financials page is a quick, property-by-property snapshot of money coming in and money going out. At a glance you can see how each property is performing over the last few months and year to date — without running a formal report. Think of it as the “how am I doing?” screen you check between reporting periods.
When to use it
- A fast monthly health check across all your properties at once.
- Spotting a property whose expenses jumped or whose income dipped, so you know where to dig in.
- A jumping-off point for common actions — add a tenant, add a charge, or receive a payment — without leaving the screen.
Before you start
- None. Anything you’ve already recorded — payments received, bills paid, miscellaneous income — shows up here automatically. There’s nothing to set up.
Steps
-
In the left sidebar, click Financials.
-
Find the property you want to review. Each property appears in its own row, listed alphabetically by name.
-
Read across the columns to compare recent periods. For each property you’ll see income, expenses, and a total (income minus expenses) broken out by recent months and by year to date.
What you’ll see
Each property row summarizes three things, repeated across each time column:
- Income — payments you’ve received from tenants, grouped by income type (for example, Rent Income or Late Fee), plus any miscellaneous income you’ve recorded. This is money actually collected, not money merely billed.
- Expenses — bills you’ve paid, grouped by expense type (for example, Repairs or Utilities). This is money actually paid out, not bills still outstanding.
- Total — income minus expenses for that period. A positive total means the property took in more than it spent; a negative total (often shown in red or parentheses) means it spent more than it took in.
Which periods are shown: the columns cover recent calendar months — this month and the two prior months — plus a Year to date column that runs from January 1 of the current year through today. Reading left to right lets you see a trend (for example, three months of rising repair costs) and the year-to-date column gives you the cumulative picture.
Tips
- The Financials page reflects actual money in and out — payments you’ve recorded and bills you’ve paid — not charges that are still owed. To see what tenants still owe, run the A/R Aging / delinquency report or the Tenants Report from the Reports page.
- Use the + Tenant, + Charge, and Receive Payment buttons at the top right of the Financials page to jump straight into common tasks without leaving the screen.
- This screen is a live summary, not a printable statement. For a formal income-and-expense statement you can print, save, or hand to an accountant, run the Cash Flow report from the Reports page — it covers the same income-vs-expense idea but over a date range you choose and in a print-ready layout.
- The Cash Flow report and this overview can show different totals because they cover different periods. The overview is fixed to recent months plus year-to-date; the Cash Flow report is whatever range you pick.
Related articles
Still stuck? Email support@tenantledger.com and a real person who knows the product will help.